📊 Full opportunity report: Bitcoin Battles Unfold in Live Warzone Visualization on ThorstenMeyerAI.com — validation score, market gap, and execution plan.
TL;DR
A groundbreaking web project visualizes Bitcoin trading as a live warzone, using real-time data from Binance and Coinbase. It offers an immersive, cinematic view of market activity, emphasizing chaos and competition without providing trading signals.
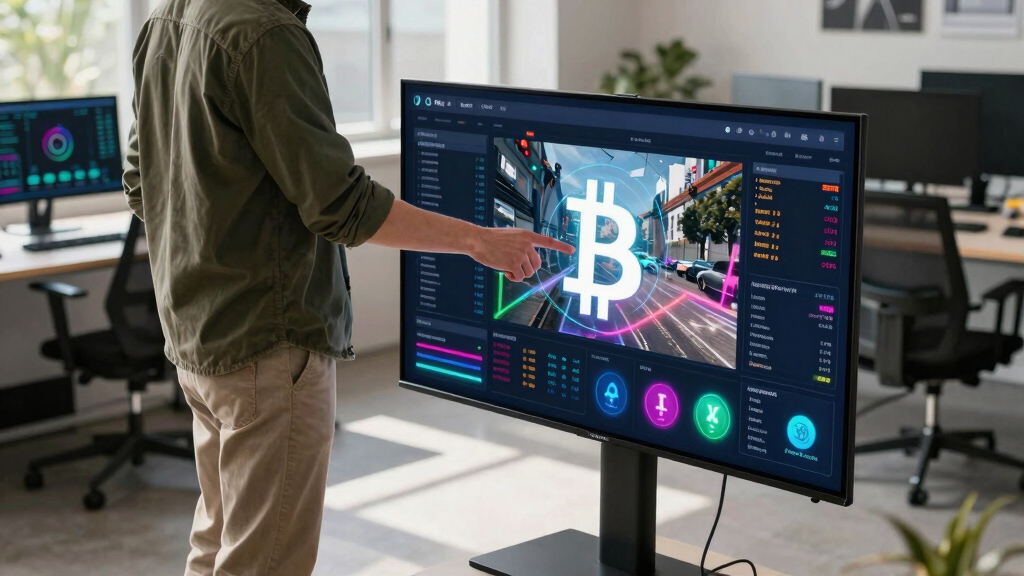
isbitcoindead.com has launched Bitcoin War, a real-time, browser-based visualization that depicts Bitcoin trading as a cinematic battlefield. The project connects directly to Binance and Coinbase trade streams, transforming market activity into dynamic war scenes with no trading advice involved. This innovative visualization offers viewers a visceral, artistic perspective on market chaos, accessible instantly in modern browsers.
The visualization, created by isbitcoindead.com, uses cutting-edge web technologies such as Canvas 2D graphics, WebAudio, and WebSocket streams to depict live BTC/USDT trades. It visualizes buy orders as advancing forces from the left and sell orders from the right, with large liquidations represented as airstrikes, creating a visceral war scene. The system automatically switches between Binance and Coinbase streams to ensure continuous data flow, with a minimal footprint of approximately 180KB, making it highly accessible.
Additional features include an automatic camera that shifts perspectives, a live DEFCON meter indicating market volatility, and a scrolling log narrating ongoing conflicts. A synthetic soundtrack generated within the browser enhances the immersive experience. The project explicitly states it is not a trading tool, emphasizing its artistic and data visualization purpose, with a footer reading, ‘a live reading of the BTC/USDT tape · no advice, only war.’
Implications of Market Warzone Visualization
This project demonstrates how advanced web technologies can be harnessed for artistic data visualization, providing an innovative lens on market activity. It offers a visceral, real-time portrayal of trading chaos, which could influence how traders, analysts, and enthusiasts perceive market dynamics. While it does not offer trading signals or advice, its immersive approach highlights the raw, unpredictable nature of cryptocurrency markets, potentially shaping future visual and educational tools in financial technology.
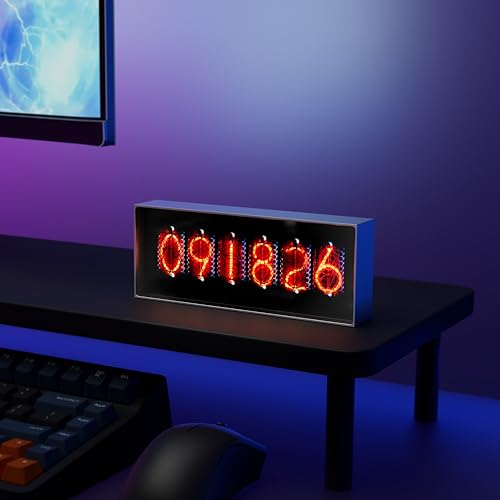
Electronic Display for Real-Time Cryptocurrency/Bitcoin/Stock Market Data, Time, Weather & Temperature, 164*28*65mm, Supports Image Upload and 30s Video Playback, App-Controlled, 960*360 Resolution
- Real-Time Data Display: Cryptocurrency, stock, time, weather updates
- Custom Media Uploads: Upload images and 30s videos
- App-Controlled Management: Control content and display modes
As an affiliate, we earn on qualifying purchases.
As an affiliate, we earn on qualifying purchases.
Background of Market Visualization Innovations
Traditional market visualizations focus on charts, order books, and technical analysis. The Bitcoin War project shifts this paradigm by turning market data into a cinematic war scene, emphasizing chaos and competition. The concept builds on recent trends toward immersive data visualization and artistic expression in financial markets, with similar projects exploring real-time data through creative formats. The project’s connection to live trade streams from Binance and Coinbase ensures an authentic, real-time experience, aligning with ongoing innovations in web-based data art.
“This visualization offers a new way to experience market activity, emphasizing chaos and competition rather than traditional analysis.”
— an anonymous researcher
Unconfirmed Aspects of the Visualization’s Impact
It is not yet clear how widely the visualization will influence market perceptions or whether it will be adopted for educational or entertainment purposes beyond initial interest. The long-term stability and accuracy of the live data streams, especially during high volatility, remain unverified. Additionally, the project’s potential to evolve into more interactive or analytical tools is still uncertain, as it currently emphasizes artistic representation.
Upcoming Developments and Potential Expansions
Developers may enhance the visualization with additional features such as historical playback, user interaction, or integration with other market data. There is also potential for the project to inspire similar artistic approaches in financial visualization, possibly influencing educational tools or entertainment platforms. Monitoring user engagement and feedback will be key to understanding its future trajectory and possible adaptations.
Key Questions
Is Bitcoin War a trading tool?
No, Bitcoin War is a visualization project designed for artistic and educational purposes. It does not provide trading signals, advice, or wallet integration.
How does the visualization connect to live market data?
The system connects directly to the Binance trade stream via WebSocket, with an automatic fallback to Coinbase, ensuring continuous real-time updates for the visualization.
Can I customize or interact with the visualization?
Currently, the visualization is designed as a passive display. Future updates may include interactive features, but as of now, it functions primarily as a cinematic, artistic representation.
Is this visualization available for free?
Yes, the project is accessible for free and can be run instantly in any modern browser by visiting war.isbitcoindead.com.
What inspired the creation of Bitcoin War?
The project aims to showcase market chaos through immersive visual art, leveraging web technologies to provide a visceral experience of trading dynamics.
Source: ThorstenMeyerAI.com